World Life Expectancy Analysis
- Jan 15, 2025
- 3 min read
Updated: Jan 23, 2025
This is my project analyzing real world life expectancy data.
Link to Code: https://github.com/schuyler-b/portfolio/blob/main/WorldLifeExpectancyExploratoryAnalysis.sql
BACKGROUND: After cleaning this data, it is now time for exploratory data analysis.
PROCESS: Used MySQL to analyze the data, using
First, let's take a look at our cleaned data. Specifically, let's look at the lowest and highest life expectancy of each country within this 15-year period.
SELECT Country,
MIN(`Life expectancy`),
MAX(`Life expectancy`)
FROM world_life_expectancy
GROUP BY Country
ORDER BY Country DESC
;
There are some countries that have 0 in both min and max.

Let's filter those out.
SELECT Country,
MIN(`Life expectancy`),
MAX(`Life expectancy`),
FROM world_life_expectancy
GROUP BY Country
HAVING MIN(`Life expectancy`) <> 0
AND MAX(`Life expectancy`) <> 0
;
Which countries made the biggest improvement from their lowest life expectancy to their highest?
SELECT Country,
MIN(`Life expectancy`),
MAX(`Life expectancy`),
ROUND(MAX(`Life expectancy`) - MIN(`Life expectancy`), 1) AS Life_Increase_15_Years
FROM world_life_expectancy
GROUP BY Country
HAVING MIN(`Life expectancy`) <> 0
AND MAX(`Life expectancy`) <> 0
ORDER BY Life_Increase_15_Years ASC
;
Countries like Haiti, Zimbabwe, Eritrea, and Uganda have made the biggest improvement.
Which countries have made minimal improvement?

Countries like Guyana, Seychelles, Kuwait, and Philippines have made minimal improvement.
What is the average life expectancy for each year?
SELECT Year, ROUND(AVG(`Life expectancy`),2)
FROM world_life_expectancy
WHERE `Life expectancy` <> 0
AND `Life expectancy` <> 0
GROUP BY Year
ORDER BY Year
;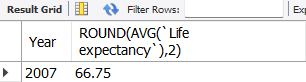

World life expectancy has improved about 5 years over a 15-year period.
Do countries with high GDP have higher life expectancy?
SELECT Country, ROUND(AVG(`Life expectancy`),1) AS Life_Exp, ROUND(AVG(GDP),1) AS GDP
FROM world_life_expectancy
GROUP BY Country
HAVING Life_Exp > 0
AND GDP > 0
ORDER BY GDP ASC
;
Keep in mind the average life expectancy over this period of time is about 68. These countries with low GDP have very low life expectancy.
SELECT Country, ROUND(AVG(`Life expectancy`),1) AS Life_Exp, ROUND(AVG(GDP),1) AS GDP
FROM world_life_expectancy
GROUP BY Country
HAVING Life_Exp > 0
AND GDP > 0
ORDER BY GDP DESC
;
These countries have high GDP and high life expectancy.
This would be good data to integrate with a data visualization tool to see the correlation better.
We can group the high and low GDP countries and look at the average life expectancy.
SELECT
SUM(CASE WHEN GDP >= 1500 THEN 1 ELSE 0 END) High_GDP_Count,
AVG(CASE WHEN GDP >= 1500 THEN `Life Expectancy` ELSE NULL END) High_GDP_Life_Expectancy,
SUM(CASE WHEN GDP <= 1500 THEN 1 ELSE 0 END) Low_GDP_Count,
AVG(CASE WHEN GDP <= 1500 THEN `Life Expectancy` ELSE NULL END) Low_GDP_Life_Expectancy
FROM world_life_expectancy
;
We can see we have 1326 high GDP countries which average a 74-year life expectancy and 1612 low GDP countries which average a 65-year life expectancy.
Now let's look at life expectancy based on status.
SELECT Status, ROUND(AVG(`Life Expectancy`),1)
FROM world_life_expectancy
GROUP BY Status
;
This shows two status types and an average of each, but I would like to know how many developing and developed countries there are.
SELECT Status, COUNT(DISTINCT Country), ROUND(AVG(`Life Expectancy`),1)
FROM world_life_expectancy
GROUP BY Status
;
This shows we only have 32 developed countries and many more developing countries, which is skewing the results in favor for the developed countries if there are high averages.
Now let's look at BMI by country and how that affects life expectancy.
SELECT Country, ROUND(AVG(`Life expectancy`),1) AS Life_Exp, ROUND(AVG(BMI),1) AS BMI
FROM world_life_expectancy
GROUP BY Country
HAVING Life_Exp > 0
AND BMI > 0
ORDER BY BMI DESC
;
This is a bit strange because even though these countries having high BMI, they also have high life expectancy overall.
Now let's look at low BMI.
SELECT Country, ROUND(AVG(`Life expectancy`),1) AS Life_Exp, ROUND(AVG(BMI),1) AS BMI
FROM world_life_expectancy
GROUP BY Country
HAVING Life_Exp > 0
AND BMI > 0
ORDER BY BMI ASC
;
These countries with low BMI on average have low life expectancy.
Now let's look at adult mortality. How many people are dying each ear in a country and is that a lot for that country?
SELECT Country,
Year,
`Life expectancy`,
`Adult Mortality`,
SUM(`Adult Mortality`) OVER(PARTITION BY Country ORDER BY Year) AS Rolling_Total
FROM world_life_expectancy
;

We can see the rolling total of adult mortality in the past 15 years in Afghanistan is 4305.
Thank you for following along. Have a great day!


Comments